rate_meter
Source: Verilog/Terminals/rtl/rate_meter.v
Where it sits (Nexys): nd120_nexys4ddr_top > terminal_top > rate_meter
- instance path: TERMINAL.g_panel.UTIL_METER
Used in: terminal_top (Nexys, MiSTer, MEGA65 R6, MEGA65 R3)
Contains: no other modules.
Module hierarchy - All modules
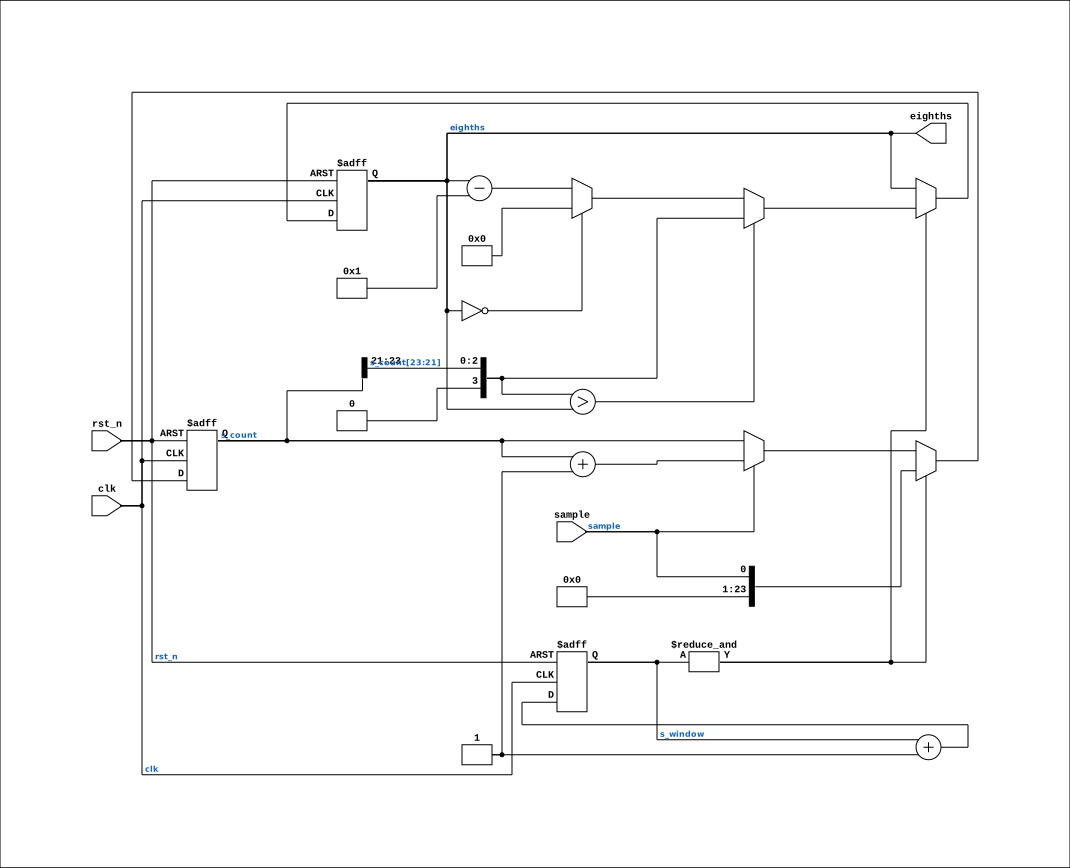
Schematic
Drawn from the Verilog: the yosys netlist of the Nexys 4 DDR build, instance TERMINAL.g_panel.UTIL_METER. Sub-modules are boxes (click the picture to open it full size; there every sub-module box links to its page, and every wire shows its Verilog name).
Parameters
| Parameter | Default |
|---|---|
WINDOW_BITS |
22 |
PEAK_HOLD |
0 |
Ports
| Direction | Width | Name | Description |
|---|---|---|---|
| input | 1 |
clk |
pixel clock (from nd120_console_mega65.clk and others) |
| input | 1 |
rst_n (active low) |
async reset, active low (from nd120_console_mega65.rst_n and others) |
| input | 1 |
sample |
counted while high |
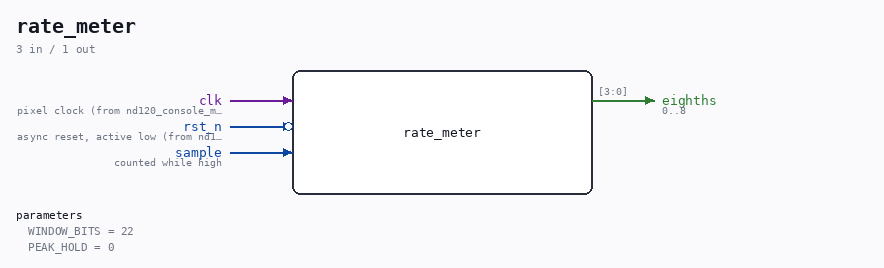
| output | [3:0] |
eighths |
0..8 |
Verilog source
Verilog/Terminals/rtl/rate_meter.v on GitHub.
Show the Verilog of rate_meter (73 lines)
//============================================================================
//! What fraction of the time was this signal high? Answer in eighths.
//!
//! Part of the board-independent terminal core (Verilog/Terminals/).
//!
//! Feeds the operator panel's UTILIZATION and CACHE HIT RATE bargraphs. The
//! real panel showed both as growing bars, and both are rates, not levels - the
//! machine gives us a single-cycle boolean (LEV0 is high while running at level
//! 0; HIT is high on a cache hit) and the bar is how often it was true.
//!
//! Counts high cycles over a window of 2^WINDOW_BITS clocks, then reports the
//! top three bits of that ratio, so the output is 0..8 eighths - exactly the
//! nine bargraph glyphs font/make_font.py synthesises.
//!
//! The result is held while the next window accumulates, so the bar never shows
//! a partial count. Without that it would flicker toward zero at the start of
//! every window, which reads as a machine going idle when it is not.
//!
//! Written 28-AUG-2026.
//============================================================================

`default_nettype none

module rate_meter #(
    //! 2^22 clocks is ~105 ms at 40 MHz - about ten updates a second, which is
    //! fast enough to look live and slow enough to read.
    parameter integer WINDOW_BITS = 22,

    //! 1 = the bar RISES at once and FALLS one eighth per window. Without it a
    //! machine that pauses drops the bar straight to zero and the display flicks
    //! between full and empty, which reads as noise. A real bargraph has lag.
    parameter integer PEAK_HOLD = 0
) (
    input wire clk,      //! pixel clock (from nd120_console_mega65.clk and others)
    input wire rst_n,    //! async reset, active low (from nd120_console_mega65.rst_n and others)

    input wire sample,   //! counted while high

    output reg [3:0] eighths  //! 0..8
);

  reg [WINDOW_BITS-1:0] s_window;
  reg [WINDOW_BITS-1:0] s_count;

  //! This window's answer, before the peak hold decides what to show.
  wire [3:0] s_new = {1'b0, s_count[WINDOW_BITS-1:WINDOW_BITS-3]};

  always @(posedge clk or negedge rst_n) begin
    if (!rst_n) begin
      s_window <= {WINDOW_BITS{1'b0}};
      s_count  <= {WINDOW_BITS{1'b0}};
      eighths  <= 4'd0;
    end else begin
      s_window <= s_window + 1'b1;

      if (&s_window) begin
        // End of the window: publish, then start again. The ratio's top three
        // bits ARE the eighths - no divide, which is the reason the window is a
        // power of two.
        eighths <= (PEAK_HOLD == 0)      ? s_new
                 : (s_new > eighths)     ? s_new
                 : (eighths == 4'd0)     ? 4'd0
                                         : eighths - 4'd1;
        s_count <= {{(WINDOW_BITS-1){1'b0}}, sample};
      end else if (sample) begin
        s_count <= s_count + 1'b1;
      end
    end
  end

endmodule

`default_nettype wire